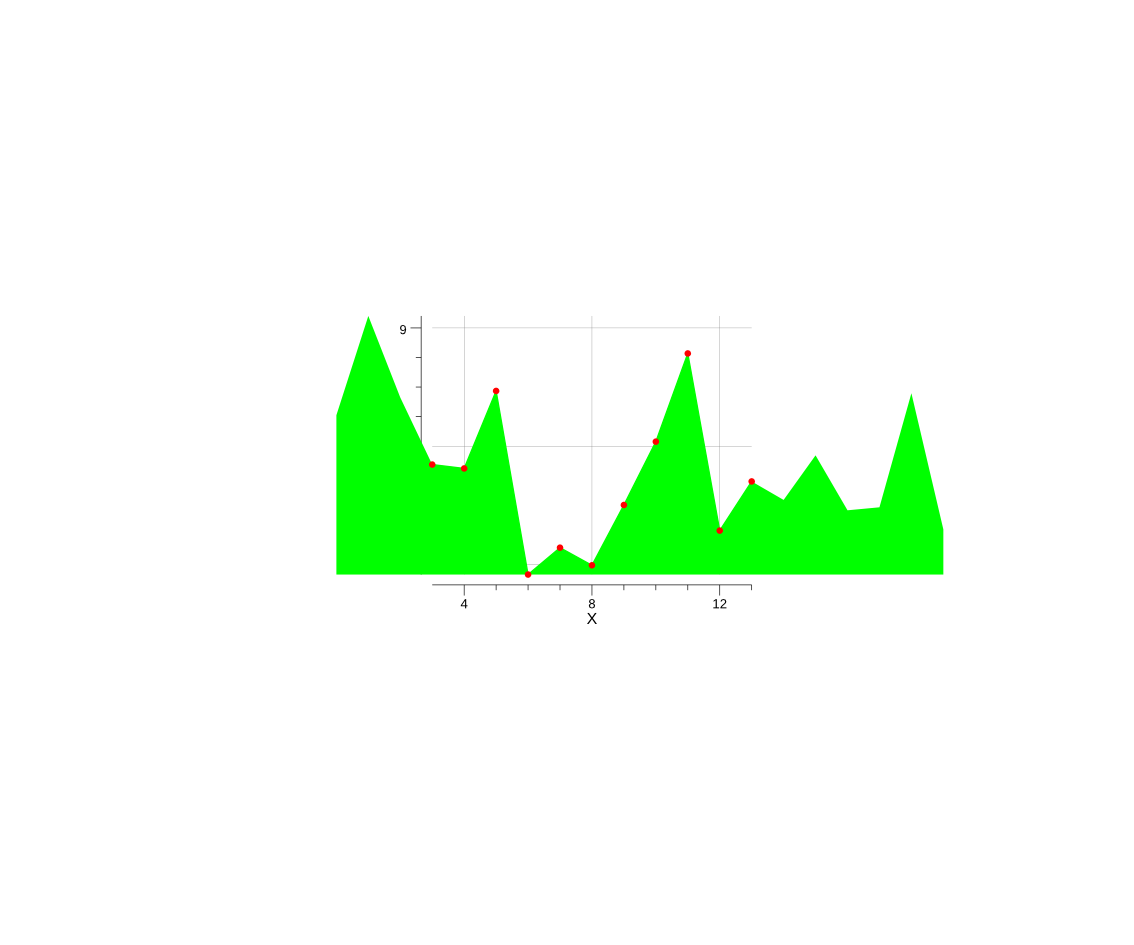
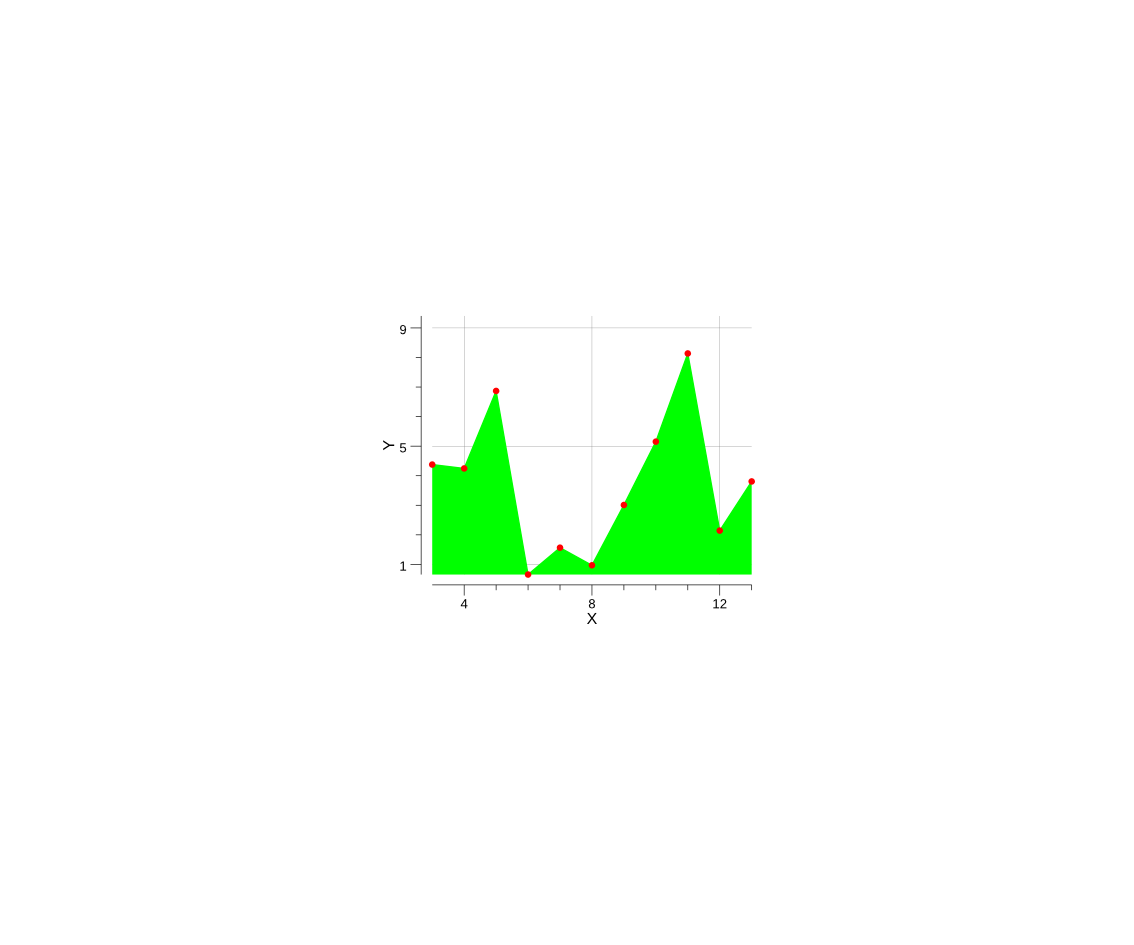
plotter: Line does not respect X-axis range
when a plotter.Line is given a fill-color (spelled ShadeColor for now) and one restricts the X axis range after the facts, the fill color bleeds out of the plot.
// +build ignore

package main

import (
	"image/color"
	"log"
	"math/rand"

	"go-hep.org/x/hep/hplot"
	"gonum.org/v1/plot/plotter"
	"gonum.org/v1/plot/vg"
	"gonum.org/v1/plot/vg/draw"
)

func main() {
	rnd := rand.New(rand.NewSource(1))

	// randomPoints returns some random x, y points
	// with some interesting kind of trend.
	randomPoints := func(n int) plotter.XYs {
		pts := make(plotter.XYs, n)
		for i := range pts {
			pts[i].X = float64(i)
			pts[i].Y = float64(10 * rnd.Float64())
		}
		return pts
	}

	n := 20
	data := randomPoints(n)

	tp := hplot.NewTiledPlot(draw.Tiles{Cols: 3, Rows: 3})
	for i := 0; i < 9; i++ {
		if i != 4 {
			tp.Plots[i] = nil
			continue
		}
		p := tp.Plots[i]
		p.X.Label.Text = "X"
		p.Y.Label.Text = "Y"
		p.Add(plotter.NewGrid())

		line, points, err := plotter.NewLinePoints(data)
		if err != nil {
			log.Panic(err)
		}
		line.Color = color.RGBA{G: 255, A: 255}
		line.ShadeColor = &line.Color
		points.Shape = draw.CircleGlyph{}
		points.Color = color.RGBA{R: 255, A: 255}

		p.Add(line)
		p.Add(points)
	}

	tp.Plots[4].X.Min = 3
	tp.Plots[4].X.Max = 13
	err := tp.Save(30*vg.Centimeter, 25*vg.Centimeter, "out.png")
	if err != nil {
		log.Panic(err)
	}
}
