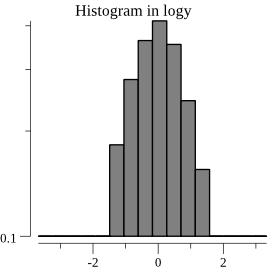
plotter: plotting an histogram in logscale
hi,
consider the following code:
func TestHistogramLogScale(t *testing.T) {
	rnd := rand.New(rand.NewSource(1))
	n := 1000
	vals := make(Values, n)
	for i := 0; i < n; i++ {
		vals[i] = rnd.NormFloat64()
	}

	p, err := plot.New()
	if err != nil {
		log.Panic(err)
	}
	p.Title.Text = "Histogram in logy"
	p.Y.Min = 0.1
	p.Y.Scale = plot.LogScale{}
	p.Y.Tick.Marker = plot.LogTicks{}

	h, err := NewHist(vals, 16)
	if err != nil {
		t.Fatal(err)
	}
	h.Normalize(1)
	p.Add(h)

	err = p.Save(200, 200, "testdata/histogram_log.png")
	if err != nil {
		t.Fatal(err)
	}
}
this will panic:
=== RUN   TestHistogramLogScale
--- FAIL: TestHistogramLogScale (0.01s)
panic: Values must be greater than 0 for a log scale. [recovered]
	panic: Values must be greater than 0 for a log scale.

goroutine 5 [running]:
testing.tRunner.func1(0xc42005a9c0)
	/usr/lib/go/src/testing/testing.go:622 +0x29d
panic(0x7d7160, 0xc4200f7790)
	/usr/lib/go/src/runtime/panic.go:489 +0x2cf
github.com/gonum/plot.LogTicks.Ticks(0x0, 0x3fda71c2dac35ff2, 0xc420123420, 0x4cbec8, 0x857cfb)
	/home/binet/work/gonum/src/github.com/gonum/plot/axis.go:429 +0x400
github.com/gonum/plot.(*LogTicks).Ticks(0xc89e68, 0x0, 0x3fda71c2dac35ff2, 0x4cc5a5, 0x857cfb, 0x9)
	<autogenerated>:42 +0x5d
github.com/gonum/plot.(*verticalAxis).size(0xc420123af8, 0x40278e0000000000)
	/home/binet/work/gonum/src/github.com/gonum/plot/axis.go:282 +0x7a
github.com/gonum/plot.(*Plot).Draw(0xc4200b3000, 0x7f6fa2e5d428, 0xc420058de0, 0x0, 0x0, 0x4069000000000000, 0x406712b000000000)
	/home/binet/work/gonum/src/github.com/gonum/plot/plot.go:168 +0x232
github.com/gonum/plot.(*Plot).WriterTo(0xc4200b3000, 0x4069000000000000, 0x4069000000000000, 0x86945b, 0x3, 0x0, 0x400aa49aec34e97f, 0x1, 0xc4200f7190)
	/home/binet/work/gonum/src/github.com/gonum/plot/plot.go:455 +0x143
github.com/gonum/plot.(*Plot).Save(0xc4200b3000, 0x4069000000000000, 0x4069000000000000, 0x869444, 0x1a, 0x0, 0x0)
	/home/binet/work/gonum/src/github.com/gonum/plot/plot.go:481 +0x147
github.com/gonum/plot/plotter.TestHistogramLogScale(0xc42005a9c0)
	/home/binet/work/gonum/src/github.com/gonum/plot/plotter/histogram_test.go:129 +0x42b
testing.tRunner(0xc42005a9c0, 0x873468)
	/usr/lib/go/src/testing/testing.go:657 +0x96
created by testing.(*T).Run
	/usr/lib/go/src/testing/testing.go:697 +0x2ca
exit status 2
because, even though p.Y.Min was set, the empty bins of the histogram will still be "evaluated".
Locally, I have implemented a not completely satisfactory hack: implement "clipping" decorators for LogScale and LogTicks:
type ClipScale struct {
	Min  float64
	Max  float64
	Norm plot.Normalizer
}

func (cs ClipScale) Normalize(min, max, x float64) float64 {
	min = math.Max(cs.Min, min)
	max = math.Min(cs.Max, max)
	switch {
	case x < cs.Min:
		x = cs.Min
	case x > cs.Max:
		x = cs.Max
	}
	return cs.Norm.Normalize(min, max, x)
}

var _ plot.Normalizer = ClipScale{}

type ClipTicker struct {
	Min    float64
	Max    float64
	Ticker plot.Ticker
}

var _ plot.Ticker = ClipTicker{}

func (ct ClipTicker) Ticks(min, max float64) []plot.Tick {
	min = math.Max(min, ct.Min)
	max = math.Min(max, ct.Max)
	return ct.Ticker.Ticks(min, max)
}
and with:
		p.Y.Scale = ClipScale{p.Y.Min, math.Inf(+1), plot.LogScale{}}
		p.Y.Tick.Marker = ClipTicker{p.Y.Min, math.Inf(+1), plot.LogTicks{}}
but it's not competely satisfactory because then we get histo-bars for these empty bins:

any idea ?